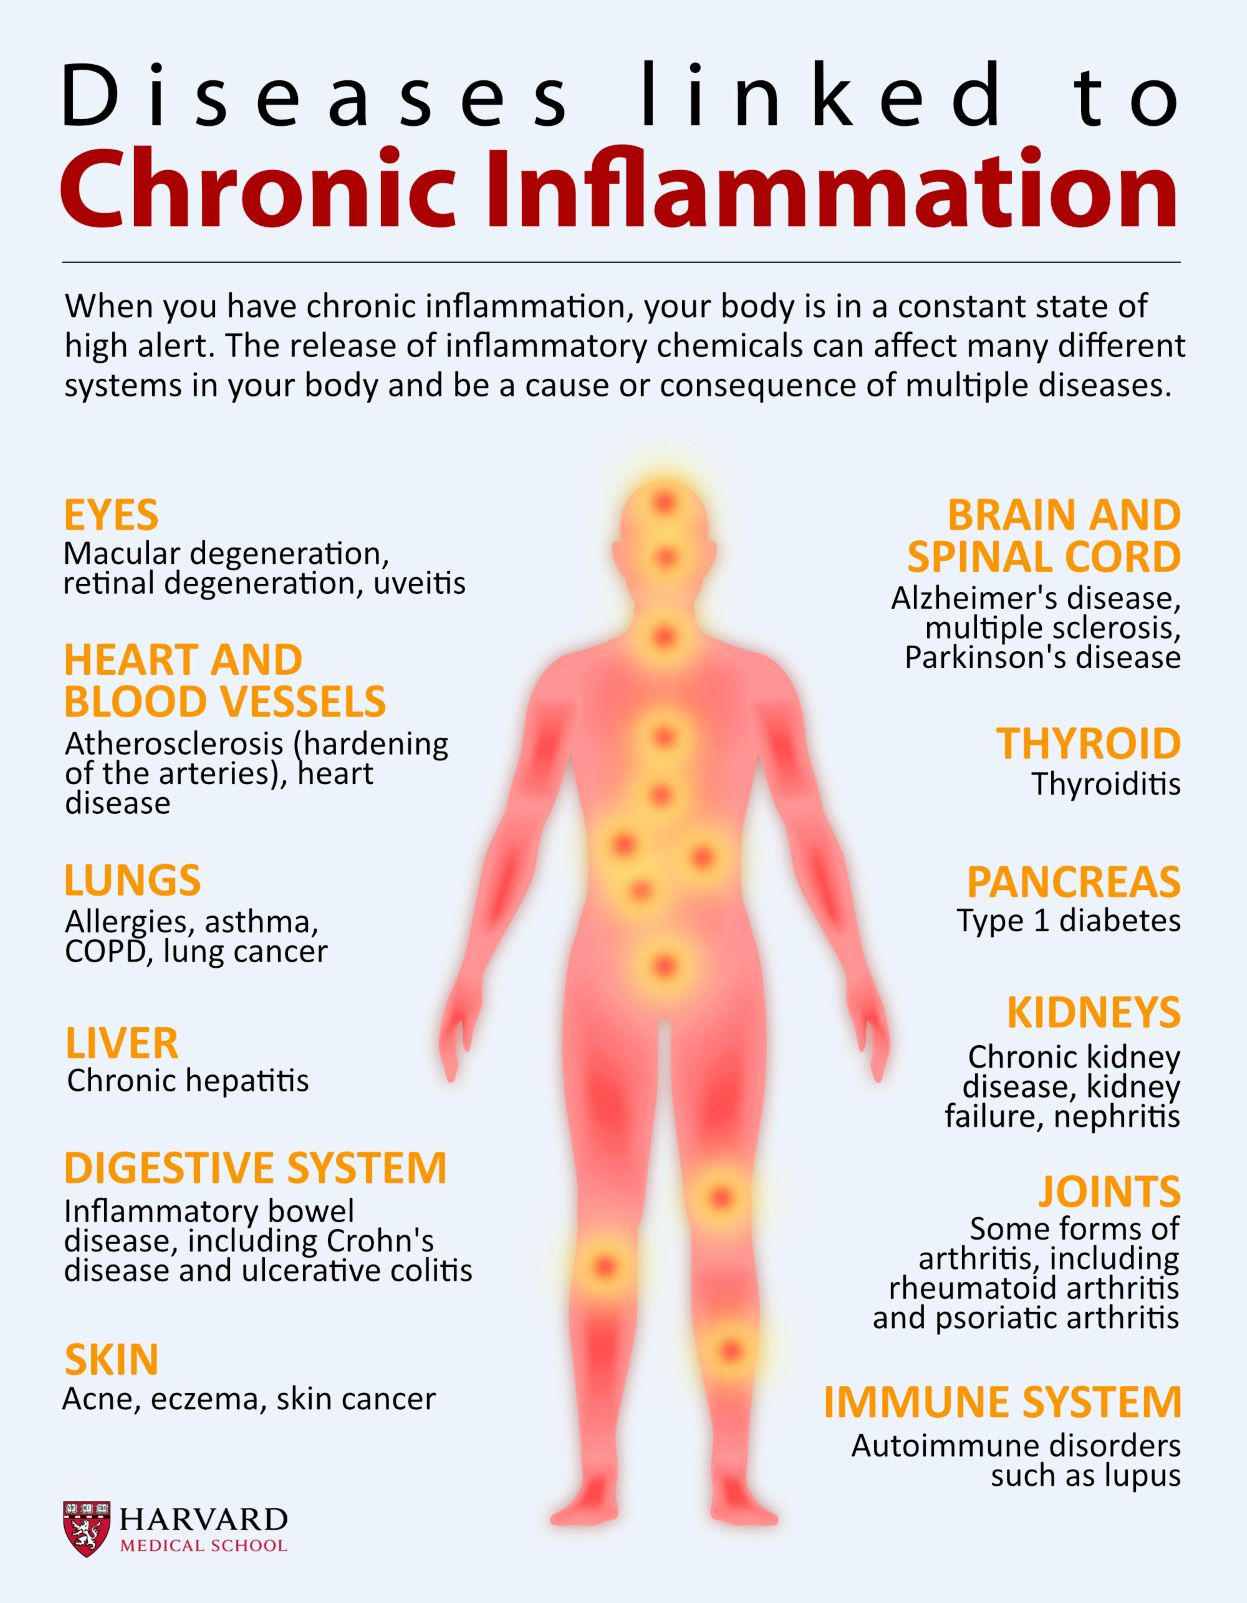
INFOGRAPHIC: DISEASE & CHRONIC INFLAMMATION
In a very good article, the Journal ‘Science’ has collated a lot of basic science regarding aerosol transmissions in viral infection generally, and Covid-19 in particular.
Early in the epidemic, I thought that large droplet transmission, which fell to the floor, and was transmitted by fomites and hand autoinoculation into the respiratory membranes, was more important. The main thesis of the article is that it is not large droplets, but aerosol particles that mainly transmit.
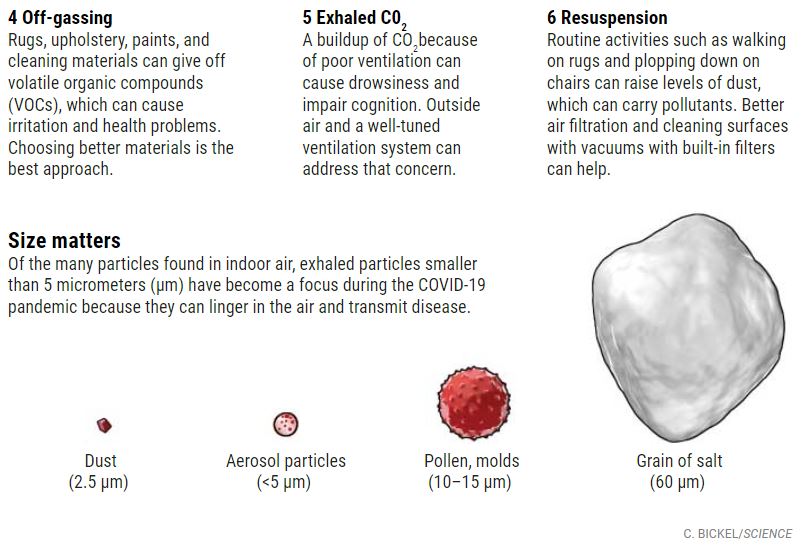
The secondary assertion is that aerosols can be up to 100 µm microns in diameter and still be transmitted by inhalation. they also stated that particle size of equal or less than 5 µm contain more virus particles than all the larger particles put together in spite of the greater mass of the larger particles . Normal speaking creates about 1000 aerosol particles per minute, And normal breathing about 7200 aerosol particles per liter of exhaled air. Coughing is more sporadic and tends to produce the larger droplets which don’t stay airborne as long, but I wouldn’t count on it.
There is a tremendous difference between individuals as to the number of particles they generate. It’s estimated that 10 to 20% of individuals account for 80 to 90% of the virus.
Slide number two deals with viral load and infectivity which is a function of the pH value, electrical charge, and other characteristics of the virus. An important point is that even though there is lots of viral RNA, that doesn’t mean that the virus is infective. Once again there’s a tremendous difference between the infective viable virus content of the aerosols from infected patient to patient. He stated that in one room with two Covid patients, they were 6 to 74 TCID/50 per liter, which means you’re almost certain to be infected if you don’t have a mask that filters out the virus, or some kind of purification in the room.
Slide Three was very interesting to me. The persistence in hours graphed against the aerosol particles size. 100 µm particles stay in the air only about five seconds, 5 µm particles stay in the air for 30 minutes, and one micrometer particles will stay in the air for 12 hours or more.
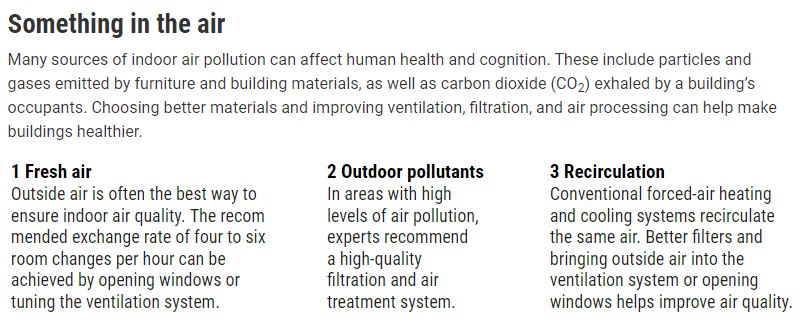
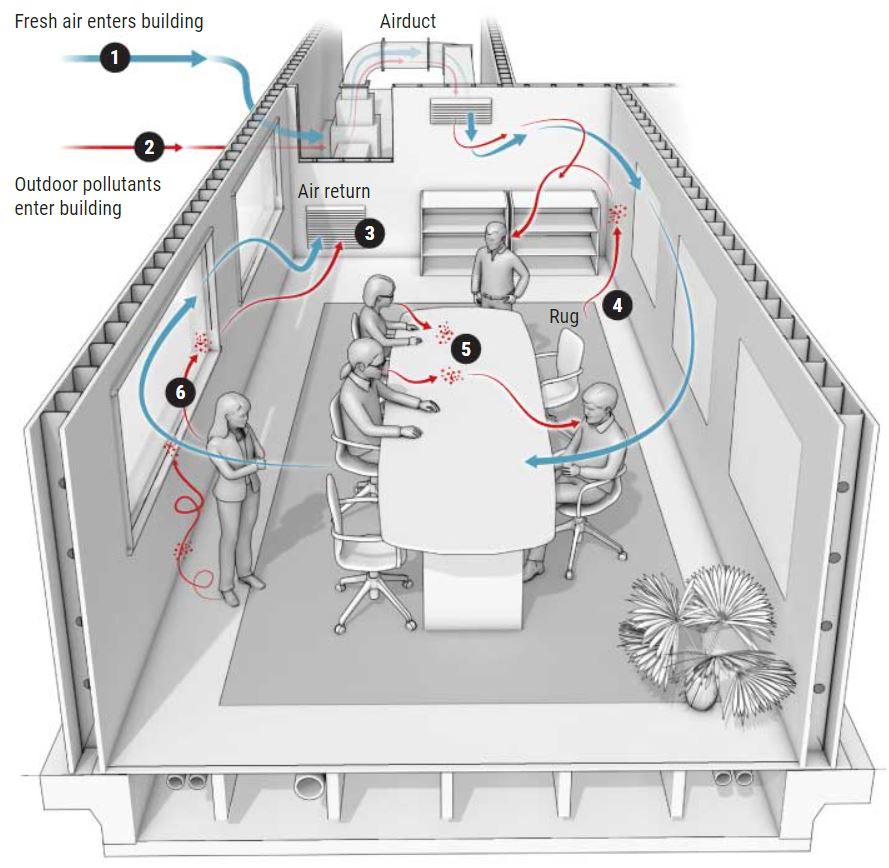
The fourth slide talks about factors affecting the distribution of indoor aerosols. There may be certain parts of the room where the particles congregate , depending on the ventilation type, whether natural, mechanical or filtered, flow patterns within the room, and indoor filtration and killing devices such as ultraviolet light.
Mention is made of the CO2 level in the room as a measure of air circulation. There is a higher CO2 in the air with lots of people and poor ventilation. The recommendation is that 7-8 ppm is about the highest acceptable level, and the possibility of using a portable HEPA filter would not be a bad idea for people frequenting indoor restaurants. Of course, outdoor air with its breezes, dispersion, less humidity, higher ultraviolet and usually Greater dispersion of people is preferable to indoor contact.
Some other interesting points are that children produce less aerosol particles because they have a smaller number of bronchi. I thought the bacteria were less likely to be aerosol transmitted than viruses, but they state that the R0 of tuberculosis can be as high as 4.3, vs. 7-8 for covid. The typical tuberculosis bacillus is relatively large, and yet is only 2 µm in length, well within the size of an aerosol particle.

COMMENTARY:
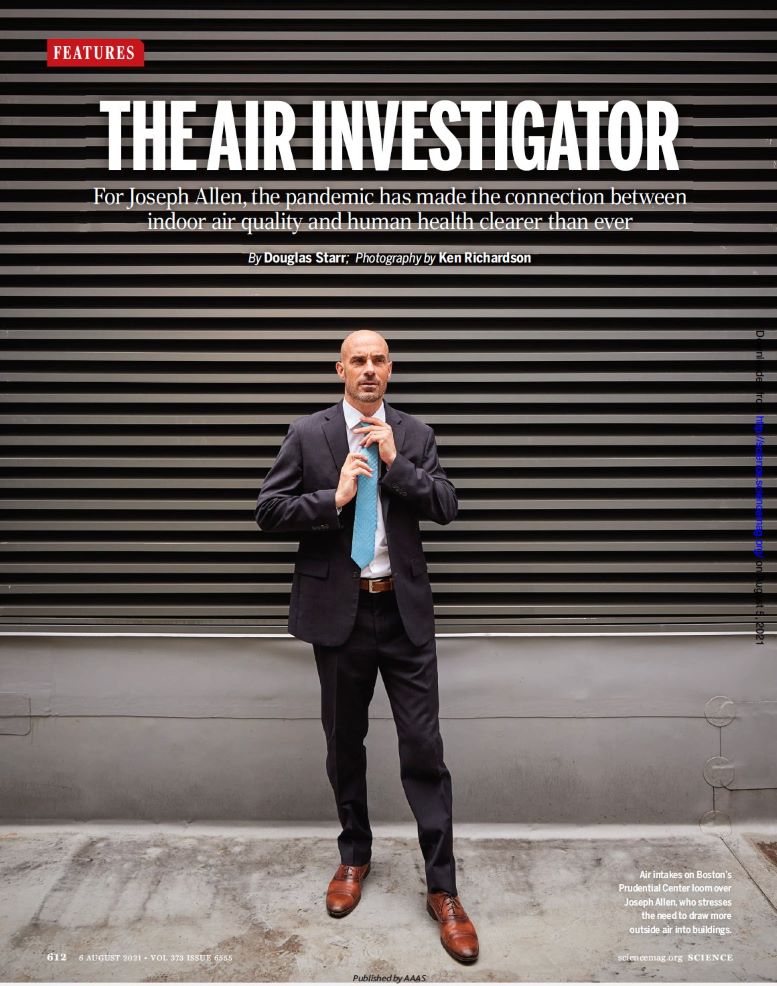
Joseph Allen, the “air investigator”, was apparently on board early in the COVID-19 epidemic, stressing the importance of suspended air particulates, less than 2 microns in size, causing transmission of the disease.
His article in Science: “clean indoor air will improve human health and cognition” is well worth reading, or at least inspecting the info graphic. As a practicing allergist, I was aware that inside dust mite particles and mold spores made allergies worse. We had a service where we would go into homes and sample the air. An excess of certain Indoor mold spores, compared with those outside, would indicate a “problem home”. We would then try to find the water leakage source that produced the molds.
I also had a patient who could not tolerate a new house, with its carpets and other artificial materials. The only place where she felt better was in an old seaside house 100 miles south of San Francisco. I thought there were some psychological factors, but who knows? Volatile organic compounds, VOCs, probably affect some people more severely.
Beginning shortly after the energy crisis in the 80s, the “sick building syndrome”, characterized by headache and fatigue in certain buildings, was on the news. The eventual solution was to create better ventilation, with a reduction of CO2 and VOCs in those buildings. In addition, federal agencies began banning certain artificial fabrics that out-gassed VOCs.
There was eventually less talk about sick building syndrome, except for the occasional air system which was contaminated with Legionella bacteria.
The present article stresses accumulation of CO2 and VOCs In the stale air in the individual home or office as a cause of diminished attention and productivity.
CO2 monitors still cost about $200, and so I think I am going to just try to increase the ventilation in my office, where I get sleepy in the afternoon, by opening the windows and sliding doors. I wonder about the indoor CO2 in Scandinavian winters, where depression is increased.

Tachycardia is the medical term for a heart rate over 100 beats per minute. There are many heart rhythm disorders (arrhythmias) that can cause tachycardia.
There are many different types of tachycardia. They’re grouped according to the part of the heart responsible for the fast heart rate and cause of the abnormally fast heartbeat. Common types of tachycardia include:
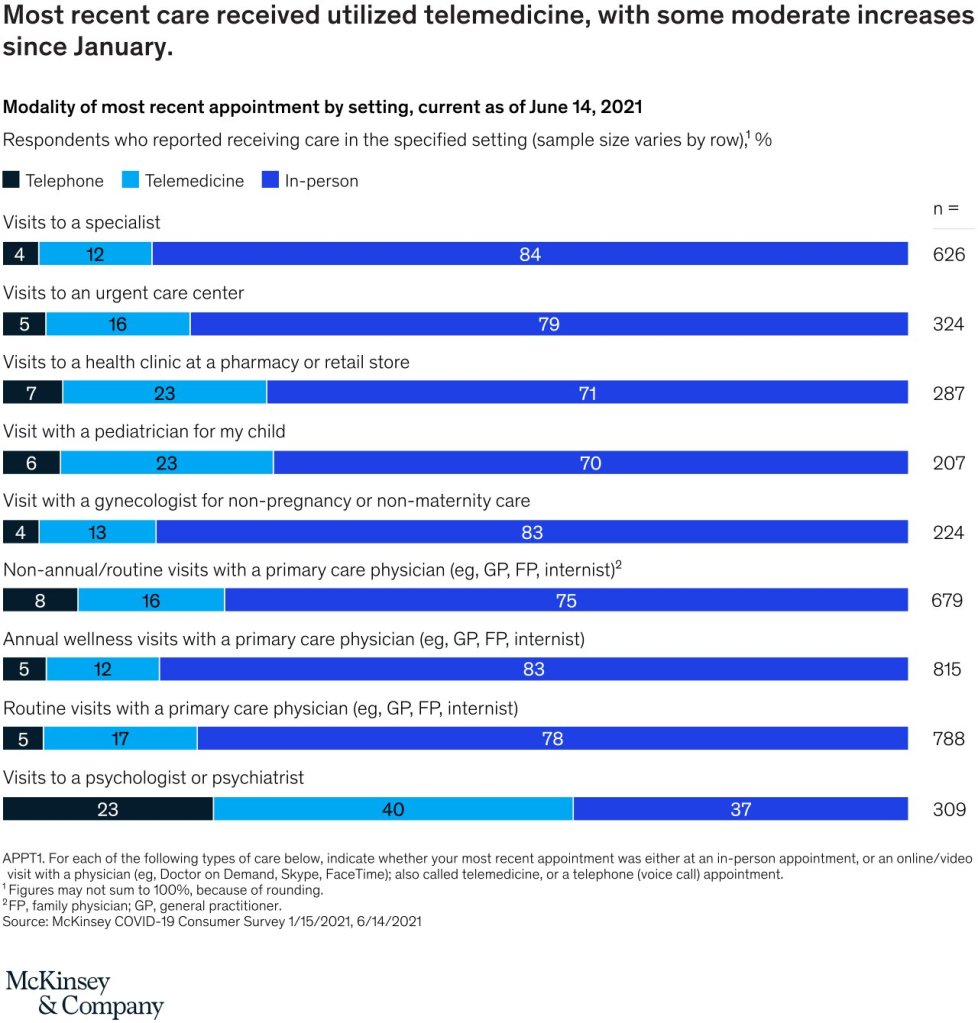
A year ago, we estimated that up to $250 billion of US healthcare spend could potentially be shifted to virtual or virtually enabled care. Approaching this potential level of virtual health is not a foregone conclusion. It would likely require sustained consumer and clinician adoption and accelerated redesign of care pathways to incorporate virtual modalities.